
The Numbers That Actually Tell You If a Community Is Healthy
Your zip code matters more than your genetic code when it comes to health outcomes. That's not hyperbole. That's data backed by decades of research into social determinants of health (SDOH).
Public health officials, researchers, and policymakers need concrete ways to measure the conditions that shape health before anyone walks into a doctor's office. The right metrics reveal where communities thrive and where they struggle. More importantly, they show where resources need to go.
What We're Actually Measuring
Social determinants of health include economic conditions, education, neighborhood quality, healthcare access, and social connections. These factors determine whether people can afford healthy food, live in safe housing, access medical care, or deal with chronic stress that wears down their bodies over time.
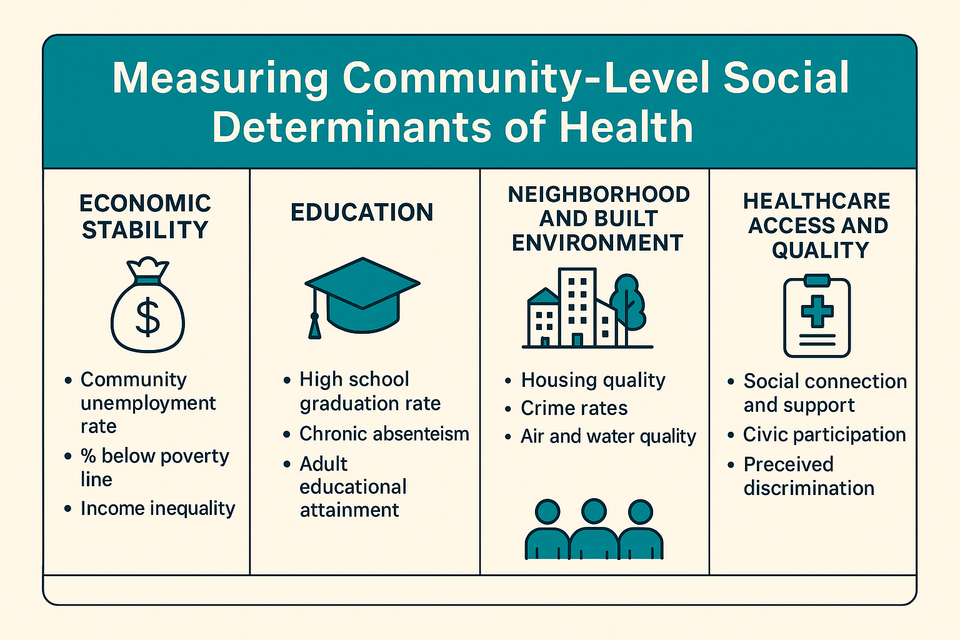
No single universal metric captures everything. But health agencies like the CDC and local public health departments have identified core indicators that paint a reliable picture of community wellbeing. These measurements fall into five major domains.
Economic Stability: The Foundation
Money determines options. Poverty rates, unemployment rates, and income inequality serve as primary indicators of economic stability in a community.
When unemployment rises, so do rates of depression, substance use, and chronic disease. Poverty creates stress that literally changes how bodies function. People living below the poverty line face higher rates of diabetes, heart disease, and premature death.
Health insurance coverage rates matter here too. Even in communities with hospitals nearby, lack of insurance means people delay care until minor problems become medical emergencies.
Education: More Than Just Test Scores
High school graduation rates, school attendance, and adult literacy levels tell you how prepared a community is to navigate health information and access opportunities.
Educational attainment correlates directly with health outcomes. People with higher education levels live longer, have lower rates of chronic disease, and access preventive care more consistently.
Education also affects health literacy. Understanding medication instructions, nutrition labels, and disease prevention information requires reading skills that not everyone has equal access to developing.
Neighborhood and Built Environment: Where You Live Shapes How You Live
Housing quality, crime rates, air and water quality, walkability, and access to green spaces determine daily exposure to health risks or health-promoting resources.
Safe housing protects against lead exposure, mold, pests, and injuries. Neighborhoods with sidewalks, parks, and bike lanes make physical activity easier. Communities with clean air and water reduce respiratory disease and cancer risk.
Crime rates matter because chronic fear creates chronic stress. High-crime neighborhoods often lack grocery stores, pharmacies, and healthcare facilities. Transportation availability determines whether people can get to work, school, or medical appointments.
Food deserts and lack of broadband internet access particularly affect rural communities, creating barriers to both nutrition and health information.
Healthcare Access and Quality: Can People Actually Get Care?
Insurance coverage rates only tell part of the story. Provider density measurements like the number of primary care physicians per capita reveal whether doctors actually practice in the community.
Preventive screening rates show whether people get the care they need before conditions become serious. A community might have hospitals, but if residents can't afford copays or take time off work, those facilities don't improve health outcomes.
Quality matters as much as access. Communities need providers who understand the populations they serve, who have resources to address complex health needs, and who aren't overwhelmed by patient loads that make thorough care impossible.
Social and Community Context: The Invisible Infrastructure
Social capital surveys, rates of civic participation, and measures of social support capture the relationships and networks that buffer against health risks.
Strong social connections predict better health outcomes independent of other factors. People with robust social networks recover faster from illness, manage chronic conditions more effectively, and live longer.
Discrimination and violence prevalence rates reveal toxic stress that damages health across generations. Communities where residents report high levels of social support show better collective health, even when facing economic challenges.
Breaking Down the Data: Why Disaggregation Matters
Raw community-level numbers hide disparities. A neighborhood with a 10% poverty rate might look healthy until you break down the data by race and discover that rate jumps to 30% for specific populations.
Health agencies recommend disaggregating all metrics by race, age, gender, and geographic area. This approach identifies which groups within communities face the worst conditions and reveals patterns that averaged numbers obscure.
Urban and rural settings need context-specific indicators too. Rural health measurement includes broadband internet access and transportation infrastructure. Urban measurement focuses on housing density, noise pollution, and access to green spaces.
What These Numbers Actually Do
Tracking SDOH metrics over time shows whether interventions work. Did that new bus route improve healthcare access? Did the community violence prevention program reduce stress-related illness? The data answers those questions.
Priority metrics inform resource allocation decisions. Public health departments use this information to target programs where they'll have the greatest impact. Policymakers justify funding requests with evidence about community needs. Healthcare systems identify neighborhoods requiring mobile clinics or extended hours.
These measurements give communities leverage to demand change. When residents can point to documented disparities in air quality, provider access, or housing conditions, they make stronger cases for investment and policy reform.
The Bigger Picture
Health doesn't start in hospitals or clinics. It starts in the conditions people face every day before they ever need medical care.
Measuring social determinants of health makes the invisible visible. The data reveals how economic policy, housing policy, education funding, and environmental regulation shape population health outcomes.
Good measurement leads to better intervention. Communities that track these indicators consistently can identify problems early, deploy resources strategically, and hold systems accountable for addressing the root causes of health inequity.
The numbers tell stories about real people navigating real barriers to wellbeing. Paying attention to those stories matters if we're serious about health equity.